Interactive Clean
The visualization infrastructure of CASA will be built out by completing pathfinder applications. These applications will build team knowledge and expand our codebase as we encounter new opportunities and challenges. Interactive clean is the first pathfinder application for the terminal usage setting. This is an important use case because it pushes the boundaries of what is possible in this usage setting.
Infrastructure
For this use case, we had certain requirements that stretched the capabilities of Bokeh browser plotting:
two directional communication was necessary between Python and the interactive clean display in the web browser
state needed to be returned to the Python session where
tcleanis running
Bokeh’s solution for the first issue is to serve the browser code from a
bokeh server process. Unfortunately, this python process is separate from the
tclean process, and interactive clean requires an ongoing dialog between
the imaging code in Python and the display the user interacts with in a browser.
To solve these problems, we introduced a WebSocket-based infrastructure
to handle the update of the browser display as tclean proceeds.
Implementation
While we are only in the prototyping phase of the interactive clean application, we have prototyped a GUI that will go beyond what is currently possible with current implementations of interactive clean, as show in this figure:
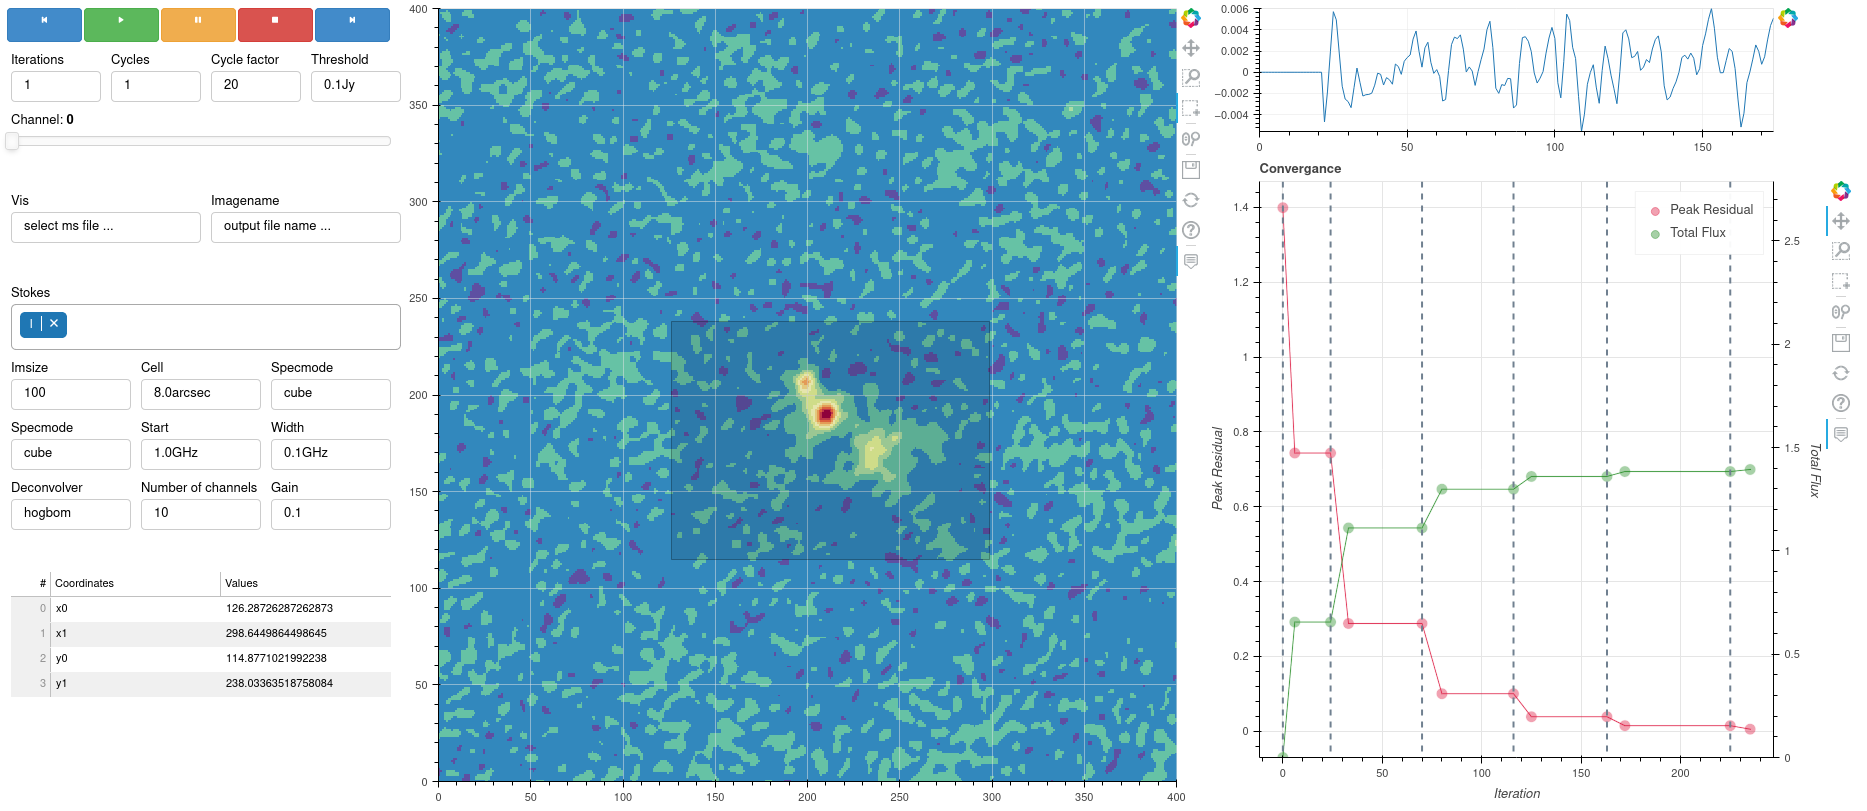
The interactive clean application has three main panel groups: control group, configuration group, and visualization group.
The control panel group provides interactive control of tclean, allowing the user to step
through the tclean process at the desired step resolution. Using the control panel,
the user has options such as play, pause, step, or stop, as well as the ability
to set properties such as the number of cycles, the interations, and the threshold value to use.
A slider is also included that allows the user to cycle through the visualization for each channel
in a smooth, responsive manner.
The configuration panel group allows the user to set the minimal input parameters to tclean,
as well as displaying information about the image cube being used. Future plans include adding an
advanced option to allow the user to access all of the tclean paramenters.
The visualization panel group displays the the current image file as well as any masks that may be
applied. For each tclean cycle, information on the residual and total flux are displayed,
as well as a histogram representing the spectral information at the current position when mousing
over the image. All three displays are updated for each finished cycle. As mentioned previously, the
display for each channel can be accessed using the control panel slider. There will be an option to
scan and display different polarizations in a future prototype.